Hello Friends, We are sharing some important Data Analysis and Interpretation & Caselets Questions with Answers solutions helpful for SBI and IBPS PO and Clerk exams 2017 2018. These data interpretation practice questions are very important for SBI PO exam and IBPS PO & other upcoming banking exams like for IBPS PO Pre and Mains, SBI PO Pre and Mains, SSC, CAT, XAT, NMAT, MAT & other exams 2017.
GRE Data Interpretation Questions and Caselets for bank exams provided by Bank4Study.com will help you a lot in your goal to crack the test. You will be taught to solve these questions better by solving many Data Interpretation and Caselets problems.
You need to practice as many DI Questions as possible for Competitive Exams to know data interpretation techniques. These questions will help you master the concepts of data interpretation better. Once you are sure that you have mastered the concepts involved in data interpretation, then you can easily crack the Quantitative Section of Exams.
A survey was conducted in five cities viz. Pune, Kanpur, Raisen, Surat and Trivandrum, for the percentage of people using T (trains), B (buses), C (cars) as modes of transport.Number of persons surveyed in the cities Pune, Kanpur, Raisen, Surat and Trivandrum are 2000, 4000, 6000, 3000 and 8000 respectively.

Question 1: The city where the least number of persons uses buses is
(a) Surat
(b) Raisen
(e) Kanpur
(d) Pune
Question 2: The average number of persons using trains for transportation in Pune, Kanpur, Raisen and Trivandrum is
(a) 1880
(b) 1750
(c) 1950
(d) None of the above
Question 3: The mode of transport used by the least number of persons in all the given cities.
(a) trains
(b) buses
(c) cars
(d) cars and buses
Question 4: Among the given five cities, the cities where less than 30% of the people use cars as transport are
(a) Kanpur and Trivandrum
(b) Pune, Kanpur and Raisen
(c) Pune and Raisen
(d) Pune, Kanpur and Surat
Questions 5 - 8 : Refer to the data in the triangular bar diagram to answer the questions that follow.
The scatter diagram shows the number of students passing in the high school’ examination in the given years from the four houses of a public School.
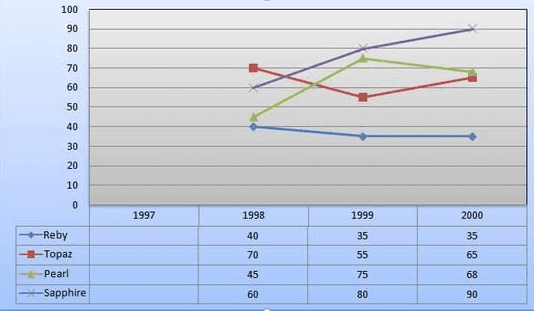
Question 5: The average number of students for each house who have passed in the given years nearest to
(a) 59
(b) 52
(c) 63
(d) 56
Question 6: The performance for which of the following houses is the best?
(a) Pearl
(b) Ruby
(c) Topaz
(d) Sapphire
Question 7: For which of the following houses is the percentage change in the results maximum for any year over the previous year?
(a) Topaz
(b) Pearl
(c) Sapphire
(d) Ruby
Question 8: The number of students keeps on increasing by 50 every years. In 1998, there were 250 students. For which of the following years is the performance best in the school?
(a) 1998
(b) 2000
(c) 1999
(d) Cannot be determined

Answer 1: (d) It can be easily observed from table that the required city is Pune. Correct option is (d)
Answer 2: (d) The total number of persons using trains for transportation in Pune, Kanpur, Raisen and Trivandrum
= 1500 + 2000 + 3000 + 1000 = 7500
The average = 7500/4 = 1875. Correct option is (d)
Answer 3: (c) From the table, cars are used by 7000 people which is least. Hence correct option is (c)
Answer 4: (c) It is clear from the graph as well as table that in both Raisen and Pune, 12.5% of the total people use car as their mode of transport. Hence answer is option (c)
Set 2 (Qus 5 - 8)
From above diagram we can make the following table :
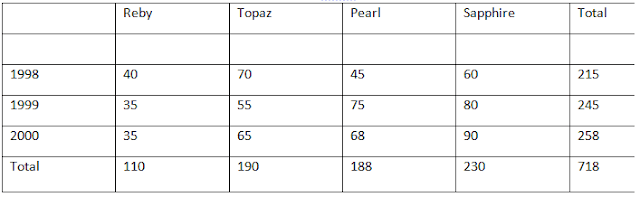
Answer 5: (a) The total number of students = 718 in all years. Average = 718/12 = 59.8 (approx) Therefore, closest option is (a)
Answer 6: (d) By the total we can see Sapphire has more students passed in 3 years as compared to others. Correct option is (d)
Answer 7: (b) In Pearl house, students passing the exam in 1999 is 75 whereas in 1998 is 45. Hence the percentage change = [Math Processing Error]
which is highest. Correct option (b)
Answer 8: (a)
 From the data, we can see that the percentage of students passing the exam is highest in 1998. Hence, the best performance is in 1998. Correct option is (a)
GRE Data Interpretation Questions and Caselets for bank exams provided by Bank4Study.com will help you a lot in your goal to crack the test. You will be taught to solve these questions better by solving many Data Interpretation and Caselets problems.
You need to practice as many DI Questions as possible for Competitive Exams to know data interpretation techniques. These questions will help you master the concepts of data interpretation better. Once you are sure that you have mastered the concepts involved in data interpretation, then you can easily crack the Quantitative Section of Exams.
Data Interpretation Practice Questions
Questions 1 - 4 : Refer to the data in the triangular bar diagram to answer the questions that follow.

Question 1: The city where the least number of persons uses buses is
(a) Surat
(b) Raisen
(e) Kanpur
(d) Pune
Question 2: The average number of persons using trains for transportation in Pune, Kanpur, Raisen and Trivandrum is
(a) 1880
(b) 1750
(c) 1950
(d) None of the above
Question 3: The mode of transport used by the least number of persons in all the given cities.
(a) trains
(b) buses
(c) cars
(d) cars and buses
Question 4: Among the given five cities, the cities where less than 30% of the people use cars as transport are
(a) Kanpur and Trivandrum
(b) Pune, Kanpur and Raisen
(c) Pune and Raisen
(d) Pune, Kanpur and Surat
Questions 5 - 8 : Refer to the data in the triangular bar diagram to answer the questions that follow.
The scatter diagram shows the number of students passing in the high school’ examination in the given years from the four houses of a public School.

Question 5: The average number of students for each house who have passed in the given years nearest to
(a) 59
(b) 52
(c) 63
(d) 56
Question 6: The performance for which of the following houses is the best?
(a) Pearl
(b) Ruby
(c) Topaz
(d) Sapphire
Question 7: For which of the following houses is the percentage change in the results maximum for any year over the previous year?
(a) Topaz
(b) Pearl
(c) Sapphire
(d) Ruby
Question 8: The number of students keeps on increasing by 50 every years. In 1998, there were 250 students. For which of the following years is the performance best in the school?
(a) 1998
(b) 2000
(c) 1999
(d) Cannot be determined
- Coding Decoding Questions Answers 25 Sets
- Puzzle 70 Sets for Exams - High Level
- How to Solve Input-Output Reasoning Questions Fast
- Blood Relations Questions - Shortcuts
- Seating And Circular Arrangement 95 Puzzles PDF 2017
- Series Completion Questions Tricks Shortcuts
- 10 Data Interpretation Sets - Free Download
Hard Data Interpretation Solutions
Set 1 (Qus 1 - 4)
Answer 1: (d) It can be easily observed from table that the required city is Pune. Correct option is (d)
Answer 2: (d) The total number of persons using trains for transportation in Pune, Kanpur, Raisen and Trivandrum
= 1500 + 2000 + 3000 + 1000 = 7500
The average = 7500/4 = 1875. Correct option is (d)
Answer 3: (c) From the table, cars are used by 7000 people which is least. Hence correct option is (c)
Answer 4: (c) It is clear from the graph as well as table that in both Raisen and Pune, 12.5% of the total people use car as their mode of transport. Hence answer is option (c)
Set 2 (Qus 5 - 8)
From above diagram we can make the following table :

Answer 5: (a) The total number of students = 718 in all years. Average = 718/12 = 59.8 (approx) Therefore, closest option is (a)
Answer 6: (d) By the total we can see Sapphire has more students passed in 3 years as compared to others. Correct option is (d)
Answer 7: (b) In Pearl house, students passing the exam in 1999 is 75 whereas in 1998 is 45. Hence the percentage change = [Math Processing Error]
which is highest. Correct option (b)
Answer 8: (a)