Hello Friends, We are sharing some important Data Analysis and Interpretation & Caselets Questions with Answers solutions helpful for SBI and IBPS PO and Clerk exams 2017 2018. These data interpretation practice questions are very important for SBI PO exam and IBPS PO & other upcoming banking exams like for IBPS PO Pre and Mains, SBI PO Pre and Mains, SSC, CAT, XAT, NMAT, MAT & other exams 2017.
GRE Data Interpretation Questions and Caselets for bank exams provided by Bank4Study.com will help you a lot in your goal to crack the test. You will be taught to solve these questions better by solving many Data Interpretation and Caselets problems.
GRE Data Interpretation Questions and Caselets for bank exams provided by Bank4Study.com will help you a lot in your goal to crack the test. You will be taught to solve these questions better by solving many Data Interpretation and Caselets problems.
You need to practice as many DI Questions as possible for Competitive Exams to know data interpretation techniques. These questions will help you master the concepts of data interpretation better. Once you are sure that you have mastered the concepts involved in data interpretation, then you can easily crack the Quantitative Section of Exams.
Data Interpretation Practice Questions
Questions 1 - 4 : Study the following graph and answer questions that follow. The x – axis denotes the years from 1983 to 1991.
Question 1: The sum of food and fertilizer production has shown a constant value for how many years?
(a) None of the years
(b) 2
(c) 4
(d) 5
Question 2: If in 1988, the sum of the food and fertilizer production was 170 million tonnes, the value of food production must have been (approximately, in million tones)
(a) 90
(b) 70
(c) 100
(d) Insufficient data
Question 3: From its apparent behavior, the food production in year 1992 can be expected to
(a) go up
(b) go down
(c) remain the same as previous year.
(d) nothing can be said.
Question 4: Going according to previous trends, one can say that the Fertilizer Production has shown an anomalous behavior in which year?
(a) 1985
(b) 1984
(c) 1991
(d) 1989
Questions 5 - 8 : Study the graph below and answer the questions that follow.
Question 2: If in 1988, the sum of the food and fertilizer production was 170 million tonnes, the value of food production must have been (approximately, in million tones)
(a) 90
(b) 70
(c) 100
(d) Insufficient data
Question 3: From its apparent behavior, the food production in year 1992 can be expected to
(a) go up
(b) go down
(c) remain the same as previous year.
(d) nothing can be said.
Question 4: Going according to previous trends, one can say that the Fertilizer Production has shown an anomalous behavior in which year?
(a) 1985
(b) 1984
(c) 1991
(d) 1989
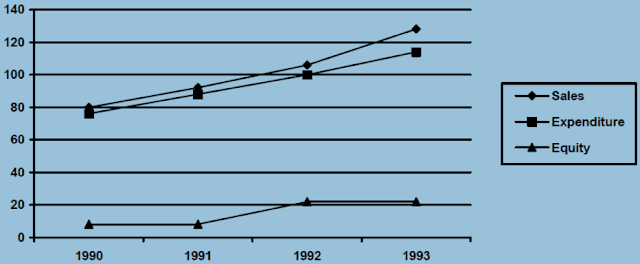
Questions 5 - 8 : Study the graph below and answer the questions that follow.

Question 5: In which year is the profit per rupee of equity the highest?
(a) 1991
(b) 1992
(c) 1993
(d) 1990 and 1991
Question 6: The simple annual growth rate in sales was the highest between the years?
(a) 1990 – 91
(b) 1991 – 92
(c) 1992 – 93
(d) 1990 – 92
Question 7: In which year are the sales per rupee of expenditure the lowest?
(a) 1990
(b) 1991
(c) 1992
(d) 1993
Question 8: In which year is a sale per rupee of equity the highest?
(a) 1990
(b) 1991
(c) 1992
(d) 1994
What Others Are Reading
Explanation (1 - 4)
What Others Are Reading
- Coding Decoding Questions Answers 25 Sets
- Puzzle 70 Sets for Exams - High Level
- How to Solve Input-Output Reasoning Questions Fast
- Blood Relations Questions - Shortcuts
- Seating And Circular Arrangement 95 Puzzles PDF 2017
- Series Completion Questions Tricks Shortcuts
- 10 Data Interpretation Sets - Free Download
Data Interpretation and Caslets Solutions
Since the values on the Y-axis are not given, we assume arbitrary values on the Y - axis.
We assume that Y-axis begins from 0 and has increments of 2 each. The table below is tabulated on the basis of the above assumption.

Answer 1: d
From the table, between 1984 and 1988, the value of sum of the food and the fertilizer is 17 which is constant for 5 years.
Answer 2: c
From the values, the production of fertilizer in 1988 is 7 And the production food is 10, i.e. the sum of values is 17.
If the production corresponds to 170 million tones, then the food production should correspond to 100 million tones.
Answer 3: b
There is alternate increase and decrease in the graph of food production shows an in every 1 to 2 years. Hence by the graph of 1990 and 1991, it can be expected that the graph will go down in 1992.
Answer 4: d
For two consecutive years the graph for fertilizer production remains constant.
This trend in 1989 breaks as it has a value of 2 instead of 7 in this year.
Explanation (5 - 8)

Answer 5: c
From the table It is clear that the profit per rupee of equity is highest for 1993 i.e. 0.51
Answer 6: c
The simple annual growth rate in sales is maximum for the year 1992-93 i.e. 20.75%
Answer 7: b
Sales per rupee of the expenditure are lowest for the year 1991 i.e. 1.04.
Answer 8: b
Sales per rupee of equity is highest for 1991 i.e. 11.5